Tags: BNSF / Warren Buffett / History
This fanpage is not officially affiliated with Berkshire Hathaway: Disclaimer
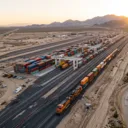
When Warren Buffett wrote a $34 billion check for the rest of BNSF in November 2009, he called it "an all-in wager on the economic future of the United States." Sixteen years later, the railroad moves 9.6 million carloads a year across 32,500 route miles in 28 states and three Canadian provinces, paid Berkshire $4.4 billion in dividends in 2025, and is worth somewhere between $108 and $200 billion at peer multiples.1 This piece is about the second-most-interesting thing about that asset: no one will ever build it again.

Introduction
Berkshire's railroad subsidiary is the largest single line item on the operating-business side of the empire — bigger than the insurance underwriting result in most years, bigger than BHE's net contribution, bigger than every manufacturer and retailer combined. In 2025 BNSF earned $5.48 billion in net income on $23.35 billion in revenue, ran an operating ratio of 65.5%, and paid Omaha $4.4 billion in dividends.1 On the BRK balance sheet it sits at carrying value. On any reasonable mark-to-market basis, it is one of the most valuable single assets the conglomerate owns.
That valuation discussion, however interesting, is the lesser argument. The more durable point is structural: BNSF is a 32,500-mile network that took roughly 150 years, a chain of federal land grants, dozens of bankruptcies, two world wars, and the Staggers Rail Act of 1980 to assemble. The Surface Transportation Board, in its current configuration, would not let anyone build the equivalent today. Not Apple. Not Saudi Aramco. Not a sovereign-wealth-fund consortium with a hundred billion dollars and a generation to spend it.
This is the BNSF moat — and what follows is an attempt to describe it precisely. There are three layers: geographic, regulatory, and operational. Each was assembled over decades, each is subject to a one-way ratchet that makes replication harder over time, and together they explain why Berkshire has been content to absorb a five-percentage-point operating-margin gap to Union Pacific without changing the asset's strategy.
The Geography of the Western Duopoly
Start with a map. North America's freight rail network is operated by six remaining Class I railroads: BNSF, Union Pacific, CSX, Norfolk Southern, Canadian National, and the new CPKC — the 2023 fusion of Canadian Pacific and Kansas City Southern. These six carry roughly 90% of all U.S. rail freight by ton-mile. Three of them — CSX, NS, and the eastern reach of CPKC — are bottled up east of the Mississippi River. CN runs a long L-shape from western Canada down through Chicago to New Orleans. That leaves the western United States — by area, the larger and faster-growing half of the continent's freight market — to exactly two operators: BNSF and Union Pacific.

This is a duopoly in the strict economic sense. Most freight origins west of the Mississippi sit on a route served by either BNSF or UNP, but rarely both. In intermodal lanes out of the Pacific ports, in Powder River Basin coal, in California-to-Texas industrial moves, the two railroads either compete directly — the relatively rare overlap — or operate parallel networks that touch only at major interchanges. There is no third western Class I. There hasn't been one since the 1996 merger that combined Burlington Northern with the Atchison, Topeka and Santa Fe — itself the product of more than a century of consolidation, with predecessor lines stretching back to the Aurora Branch Railroad of 1849.2
BNSF's network is anchored by three transcontinental routes:
- The Southern Transcon, the former ATSF "race track" from Los Angeles to Chicago. Roughly 2,200 miles, almost entirely double-tracked since 2006, with triple track over Cajon Pass into the Los Angeles Basin. This is the highest-volume intermodal artery on the continent. If a container ship arrives at the Port of Long Beach and the box is bound for Chicago by rail, it almost certainly leaves on the Southern Transcon.2
- The Northern Transcon, the former Great Northern and Northern Pacific routes from Seattle and Portland east to Chicago. It crosses the Continental Divide at Marias Pass in Montana — at 5,213 feet, the lowest mainline rail crossing in the northern Rockies. Stampede Pass in Washington State, mothballed in 1983 and reopened in 1996, runs as a relief route.3
- The Powder River Basin coal corridor, including a 103-mile triple- and quad-tracked joint line that BNSF shares with Union Pacific in southeastern Wyoming. Even after a decade of structural decline in U.S. coal demand, BNSF moved 1.218 million coal carloads in 2025, generating roughly $3.0 billion in revenue.1
The federal land grants Lincoln signed in 1862 to fund the original transcontinental, plus a half-century of state and territorial grants thereafter, made the early western railroads economically possible. By the time those grants expired the network was built and consolidated; it has never been subsidized into existence again. Add the chokepoints — Cajon, Marias, Tehachapi, Stampede, the joint line through Gillette — and you have a network whose physical geography was set by the elevation profile of the Western United States and the political economy of the late 19th century. A new entrant would need to either acquire trackage rights from BNSF and UNP — which neither has any incentive to grant on competitive terms — buy thousands of square miles of right-of-way through populated states, or invent some new mode of moving a 100-car coal unit train across the Rockies. None of these are happening.
The Consolidation Ratchet
If the geography is the static moat, the regulatory framework is the dynamic one — and it has been moving in BNSF's favor for nearly half a century.
In the early 1920s the United States had over 170 Class I railroads under the then-current revenue threshold. By 1980 the count was around 40. Today there are six. The trajectory is not an accident; it is the joint product of two pieces of legislation that bookended the modern industry.
The first was the Staggers Rail Act of 1980, signed into law by Jimmy Carter on October 14 of that year. The pre-Staggers railroad industry had been a slow-motion bankruptcy for thirty years — Penn Central, the largest, had failed in 1970 in what was then the biggest corporate collapse in U.S. history. Staggers freed the railroads to set their own rates, sign confidential contracts with shippers, and abandon unprofitable routes without asking the Interstate Commerce Commission's permission. Within ten years inflation-adjusted rates had halved, productivity had doubled, and ton-miles were rising for the first time since the 1940s.4 The act saved the industry — and locked in the consolidation that had already started.
The second was the 2001 STB merger review reform, the response to two operationally botched mergers in the late 1990s: Union Pacific's takeover of Southern Pacific in 1996 and the joint NS/CSX dismemberment of Conrail in 1998. Both produced months of service collapse. The Surface Transportation Board responded by raising the bar: a major railroad merger would now have to demonstrate that it enhanced competition, not merely preserved it.5 In practice, this killed parallel-route consolidation. Two railroads serving the same corridor could no longer simply combine.
The result is a regulatory ratchet. The 2023 CPKC merger — the first major Class I combination in over twenty years — was approved precisely because it was end-to-end. Canadian Pacific and Kansas City Southern connected only at Kansas City; their networks did not overlap. The STB had to cite the 2001 standards in clearing it, and even then only after two years of review.6
The current test is the Union Pacific–Norfolk Southern deal, announced July 29, 2025 at approximately $85 billion. It would create the first true U.S. transcontinental railroad and reduce the Class I count from six to five. The STB rejected the initial application as incomplete on January 16, 2026, citing missing competition-impact analysis and post-merger market-share data; the parties planned to refile in late April 2026.7 Berkshire's response, in the 2025 annual letter, was unusually specific:
"We are not interested in acquiring another Class I railroad. The current economics would not work in our shareholders' favor. BNSF is focused on ensuring it retains full and competitive access to Eastern rail markets."8
In other words: BNSF will not match a UNP-NS combination by buying CSX. It will instead lobby the STB to ensure that whatever merger gets approved, BNSF's interchange access to the East is protected. That is the move of a moat operator who already has the asset, not a builder trying to assemble one. The map can change at the margins. The set of players cannot grow.
How Berkshire Got Here

The acquisition itself is worth a few paragraphs of historical context, because it is one of the cleanest examples of Buffett betting on infrastructure as duration.
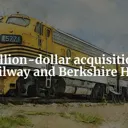
Berkshire began accumulating BNSF stock on the open market in 2007, when the railroad was an anonymous Fortune-500 line item trading in the $70s. By the time of the November 2009 announcement, Berkshire owned approximately 22.5% of the company.9 On November 3, 2009 — in the depths of the post-Lehman recession — Berkshire announced an agreement to buy the remaining 77.5% at $100 per share, in a mix of approximately 60% cash and 40% Berkshire stock. The total transaction value was about $44 billion including assumed debt; the equity outlay was roughly $34 billion. The deal closed in February 2010.10
Two details from the negotiation are worth flagging. First, Buffett's internal valuation, as reconstructed in Berkshire Beyond Buffett, was approximately $95 per share — yet he offered $100 to ensure the minority shareholders received unambiguously fair treatment. The BNSF board, doing the predictable, pressed twice for more. Buffett held the line.11 Second, the announcement language — the "all-in wager" framing — was unusual not for the rhetoric but for the duration implied. Buffett, who had spent a career allergic to capital-intensive cyclicals, was committing Berkshire to an asset whose payback profile measured in decades.
He was right to. From the close of the deal through the end of 2025, BNSF has paid Berkshire approximately $46 billion in cumulative dividends and reinvested roughly $41 billion in fixed assets above and beyond depreciation.12 The carrying value at acquisition has been more than doubled by retained earnings; the cash returns alone have already exceeded the original equity outlay. Whatever valuation lens one applies today, the wager has resolved in Berkshire's favor — and the resolution is still in progress.
Freight Mix as Network Reflection
A second way to see the moat is in what flows through it. BNSF's 2025 revenue split, derived from carload categories the BRK 10-K reports approximately:1
| Segment | 2025 Revenue | Carloads/Units (000s) | % of Revenue |
|---|---|---|---|
| Consumer products | ~$8.2B | 5,601 | ~35% |
| Agricultural & energy products | ~$6.6B | 1,421 | ~28% |
| Industrial products | ~$5.0B | 1,382 | ~21% |
| Coal | ~$3.0B | 1,218 | ~13% |
| Other / non-freight | ~$0.6B | — | ~3% |
| Total | ~$23.4B | 9,622 | 100% |
Compare that with Union Pacific, which reports under three labels — Bulk, Industrial, and Premium — that map roughly to the same commodities tilted differently. UNP is heavier on Texas-to-Mexico industrial and chemical traffic and on the Sunset Route from Los Angeles to El Paso. BNSF is heavier on Pacific Northwest grain exports — the Northern Transcon's reason for being — Powder River coal still at 13% of revenue even in decline, and the Southern Transcon intermodal flow from the LA-Long Beach port complex.13
This is the structural difference between two railroads that look superficially identical on a route-mile map. Each has roughly 32,000 mainline route miles. Each is a duopoly partner in the western United States. But what crosses each network is determined by the network's geography — and the Pacific ports, the Northwest grain belt, and the Powder River Basin are accidents of which 19th-century route survived bankruptcy. BNSF has a structural tilt toward the Pacific Rim; UNP has a structural tilt toward Mexico. Neither can swap, and the differences compound over decades through where each chooses to invest.
The PSR Question
The third moat layer is the most counterintuitive: BNSF's operational philosophy is, by Wall Street's preferred metric, worse than its peers'.
The metric is the operating ratio — operating expenses divided by revenue. Lower is better. Hunter Harrison's Precision Scheduled Railroading method, pioneered at Illinois Central in 1993 and exported to CN, CP, CSX, NS, and ultimately UP, has structurally lowered Class I operating ratios into the high 50s and low 60s. Trains run on fixed schedules, locomotives turn faster, hump yards close, employee counts come down, and headline margins improve.
By the GAO's 2023 review, six of the seven largest U.S. freight railroads had implemented PSR in some form. BNSF was the lone holdout.14
The numbers tell the cost. BNSF's 2025 operating ratio was 65.5%; Union Pacific's was 59.8%. CPKC, with PSR in its institutional DNA, ran 59.9% on an adjusted basis. Norfolk Southern, post-PSR, ran 64.2%. Canadian National, where PSR began, ran 61.9%.115

Buffett, never one to dodge an unflattering comparison, addressed the gap directly in the 2023 annual letter:
"Though BNSF carries more freight and spends more on capital expenditures than any of the five other major North American railroads, its profit margins have slipped relative to all five since our purchase. I believe that our vast service territory is second to none and that therefore our margin comparisons can and should improve."16
The 2025 letter went further, attaching a number: "Each one-percentage-point improvement in operating margin generates approximately $230 million of incremental operating cash flow for our owners."8 At the current 5.7-percentage-point gap to UNP, that implies roughly $1.3 billion in annual cash flow that BNSF is leaving on the table relative to a PSR-equivalent peer.
So why has Berkshire not converted? The case for sticking with the current strategy comes from CEO Katie Farmer and traces to a deliberate choice. PSR optimizes for cost efficiency by reducing redundancy — fewer hump yards, fewer routes, fewer locomotives standing by, fewer service backstops. When a Polar Vortex closes a mainline, a PSR network has a harder time recovering because the slack capacity has been priced out. BNSF's response under Farmer has been to invest in service quality at the cost of margin: building rather than closing hump yards, triple-tracking the Southern Transcon, opening the new Barstow International Gateway as a 4,500-acre inland port near Los Angeles, and maintaining redundant routes between Kansas City and Chicago.17 Farmer's framing: BNSF measures intermodal performance "in minutes and not hours."
This is a structural choice that only Berkshire's patient capital makes possible. A publicly traded UNP, NS, or CSX would face activist pressure to close the margin gap immediately. A subsidiary of Berkshire — owned by a holding company whose CEO writes annual letters complaining about the gap but does not fire the operators — can afford to run the network for service quality and let the operating ratio compound more slowly. Whether the Abel-era Berkshire continues this stance is, fairly, an open question. Greg Abel's first 100 days as CEO ↗ explicitly identified the BNSF margin gap as one of three structural issues he inherited. The 2025 letter's tone — "the gap to the industry's best remains too wide and closing it will require continued improvements in efficiency and service" — sounds more like a man who intends to close it than a man who intends to defend the choice.
Capital Intensity as a Moat Multiplier
A railroad is the most capital-intensive transport mode in existence. Track must be replaced or upgraded continuously; locomotives have 30-year service lives but require multi-million-dollar overhauls; signal systems must keep up with federal mandates — Positive Train Control, in BNSF's case, was a roughly $2 billion implementation in the late 2010s; bridges and tunnels age. The number every Class I has to live with is capex as a percentage of revenue, and it does not move below the mid-teens.
BNSF's recent capex history:18
| Year | Capex ($M) | Revenue ($M) | Capex / Revenue |
|---|---|---|---|
| 2020 | $3,063 | ~$19,200 | ~16% |
| 2021 | $2,910 | ~$21,400 | ~14% |
| 2022 | $3,532 | $25,888 | 13.6% |
| 2023 | $3,920 | $23,876 | 16.4% |
| 2024 | $3,690 | $23,355 | 15.8% |
| 2025 | $3,796 | $23,350 | 16.3% |
| 2026 (planned) | $3,600 | — | ~15% |
Cumulatively since the 2010 acquisition, BNSF has invested approximately $41 billion in fixed assets above and beyond depreciation — meaning the network today is not the same physical asset Berkshire bought. It is a substantially upgraded version, with roughly $20 billion in net additions to track, signaling, terminals, and equipment beyond what depreciation alone would have provided.12
This is where the moat compounds. A duopoly franchise plus a regulatory ratchet plus a depreciation gap that throws off enough cash to reinvest above replacement plus a parent willing to forgo dividends some years to fund expansion equals a railroad that gets quietly, structurally better every year. The Barstow International Gateway — scheduled to start construction in 2026 with a planned $1.5 billion-plus build — is a useful tangible example: a 4,500-acre intermodal complex in the Mojave Desert, 80 miles inland from the LA-Long Beach port complex, designed to take container sortation off the congested Los Angeles Basin and into a purpose-built rail-served facility on BNSF's Southern Transcon.19 No competitor can build something equivalent in California without rail access that doesn't exist. BNSF can build it because it owns the only westbound rail out of the desert. This is the kind of infrastructure investment ↗ that Berkshire's patient capital uniquely enables.
What It's Worth
We promised the valuation argument would be the lesser one, but it is worth ending there because it is the part most visible to public-market investors who only see BNSF through the BRK 10-K's segment disclosure. The carrying value tells one story; the implied market value tells another.
BNSF earned $5.48 billion in net income on $8.06 billion in operating earnings and produced $8.1 billion in net operating cash flow in 2025.1 Three valuation lenses converge on a range:
- Earnings multiple, Union Pacific style. UNP's trailing P/E is approximately 19.7x; applying it to BNSF's 2025 net income of $5.48 billion implies an equity value of roughly $108 billion.20
- EV/EBITDA, Class-I style. BNSF's 2025 EBITDA — operating earnings plus $2.72 billion of depreciation — is approximately $10.78 billion. UNP trades at roughly 13.3x EV/EBITDA. The implied enterprise value is approximately $143 billion. Subtracting BNSF's segment debt of about $23.5 billion yields roughly $120 billion in equity value.20
- Free cash flow yield, infrastructure style. At a 4% FCF yield — a reasonable cap rate for a high-grade infrastructure asset — $8.1 billion in operating cash flow capitalizes to roughly $200 billion. At a more conservative 5%, the value is $162 billion.
The valuation range is wide — call it $108 to $200 billion — but the midpoint sits comfortably above $120 billion, and even the lowest figure sits well above the colloquial $100 billion mark. None of this appears at full value on Berkshire's balance sheet, where BNSF is carried at historical cost less depreciation. The unrealized gain is among the largest hidden assets in the conglomerate. Last year's organic-growth story ↗ looked at the operating side of this same gap; the valuation gap has only widened since.
Conclusion
There are three useful ways to think about BNSF as a Berkshire holding. The first is as a financial asset: a $5 billion-a-year earner with $4 billion-a-year dividends and double-digit valuation upside on any peer-multiple basis. That story is fine and unsurprising. The second is as a moat: a 32,500-mile network protected by 150 years of bankruptcies, a 1980 deregulatory act, a 2001 merger-review reform, and a duopoly partnership with Union Pacific that no third entrant can crack. That story is more interesting and more durable. The third is as a wager — Buffett's "all-in wager on the economic future of the United States" — and that one resolves slowly.
Sixteen years in, the wager has paid out $46 billion in cumulative dividends and continued to compound the underlying asset. Whatever Greg Abel decides about closing the operating-ratio gap to Union Pacific — and the 2025 letter strongly hints he intends to — he inherits an asset that earns more, hauls more, and is worth more than it was when Buffett wrote the check. He inherits something else, too: the knowledge that no competitor will ever assemble the equivalent. The Surface Transportation Board would not allow it. The Pacific land grants are gone. The mountain passes are spoken for. The freight is going to move on BNSF or UNP, and that has been true since 1996 and is more true every year.
The 2026 capex plan is $3.6 billion. The Barstow facility breaks ground this year. The tariff cycle ↗ will rotate the consumer-products carload count, but it will not change the fact that whatever moves west of the Mississippi pays a toll to one of two operators, and one of them is owned by Berkshire. The moat is not depreciating. It is deepening.
References
-
Berkshire Hathaway 2025 Annual Report - berkshirehathaway.com ↩↩↩↩↩↩↩
-
Southern Transcon - wikipedia.org ↩↩
-
Marias Pass - wikipedia.org ↩
-
The Staggers Act of 1980 - aar.org ↩
-
STB History and Major Merger Rules - stb.gov ↩
-
STB Approves CP-KCS Merger - stb.gov ↩
-
STB Rejects Initial UP-NS Merger Application as Incomplete - stb.gov ↩
-
Berkshire Hathaway 2025 Annual Letter - berkshirehathaway.com ↩↩
-
Revisiting Berkshire's BNSF Acquisition - rationalwalk.com ↩
-
Lawrence A. Cunningham, Berkshire Beyond Buffett: The Enduring Value of Values (Columbia Business School Publishing, 2014). ↩
-
Berkshire Hathaway 2020 Annual Report - berkshirehathaway.com ↩↩
-
Union Pacific Q4 2025 Earnings Release - up.com ↩
-
GAO: Freight Rail — Information on Precision Scheduled Railroading Implementation - gao.gov ↩
-
CPKC 2025 PSR Operating Ratio - stocktitan.net ↩
-
Berkshire Hathaway 2023 Annual Letter - berkshirehathaway.com ↩
-
BNSF's Katie Farmer on PSR and Service Quality - supplychaindive.com ↩
-
BRK 10-K segment data, 2020–2025. See 1 and prior annual reports. ↩
-
BNSF's $1.5B Barstow International Gateway - vvng.com ↩
-
Union Pacific valuation statistics - stockanalysis.com ↩↩